
1
Kick-off Call
The project began with clarifying goals, aligning expectations, and defining what the new website needed to achieve for Point Express.
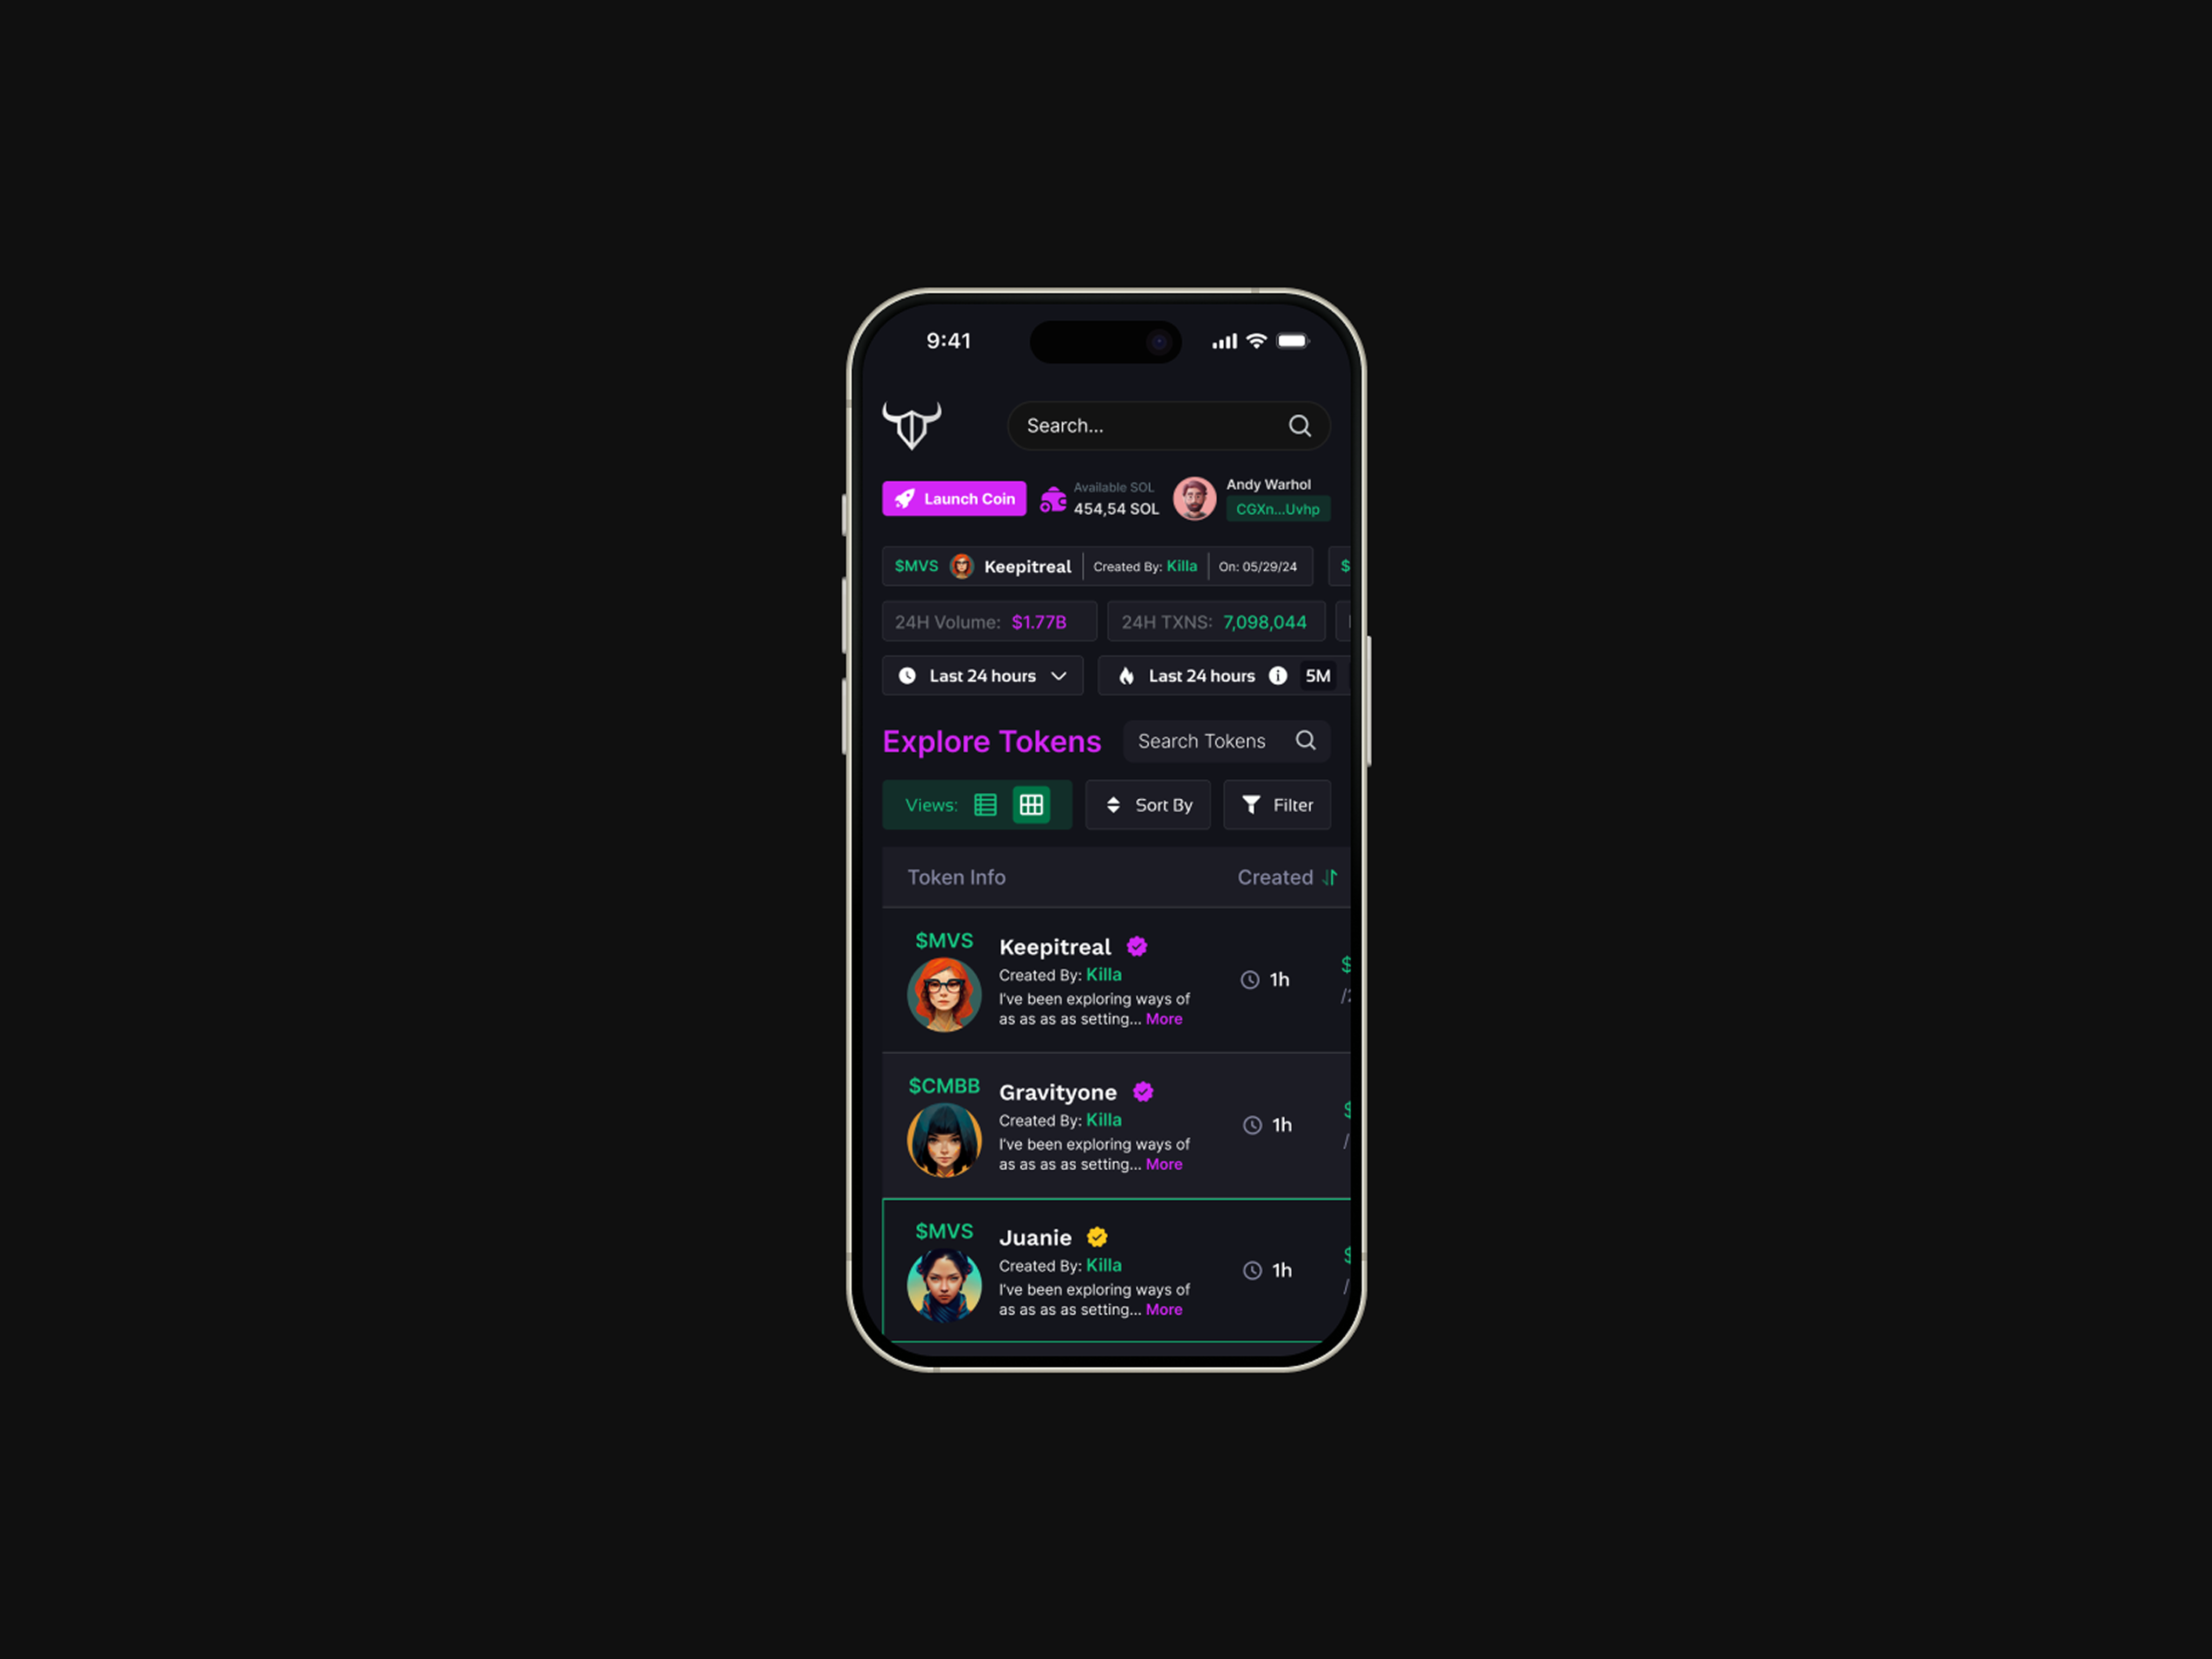
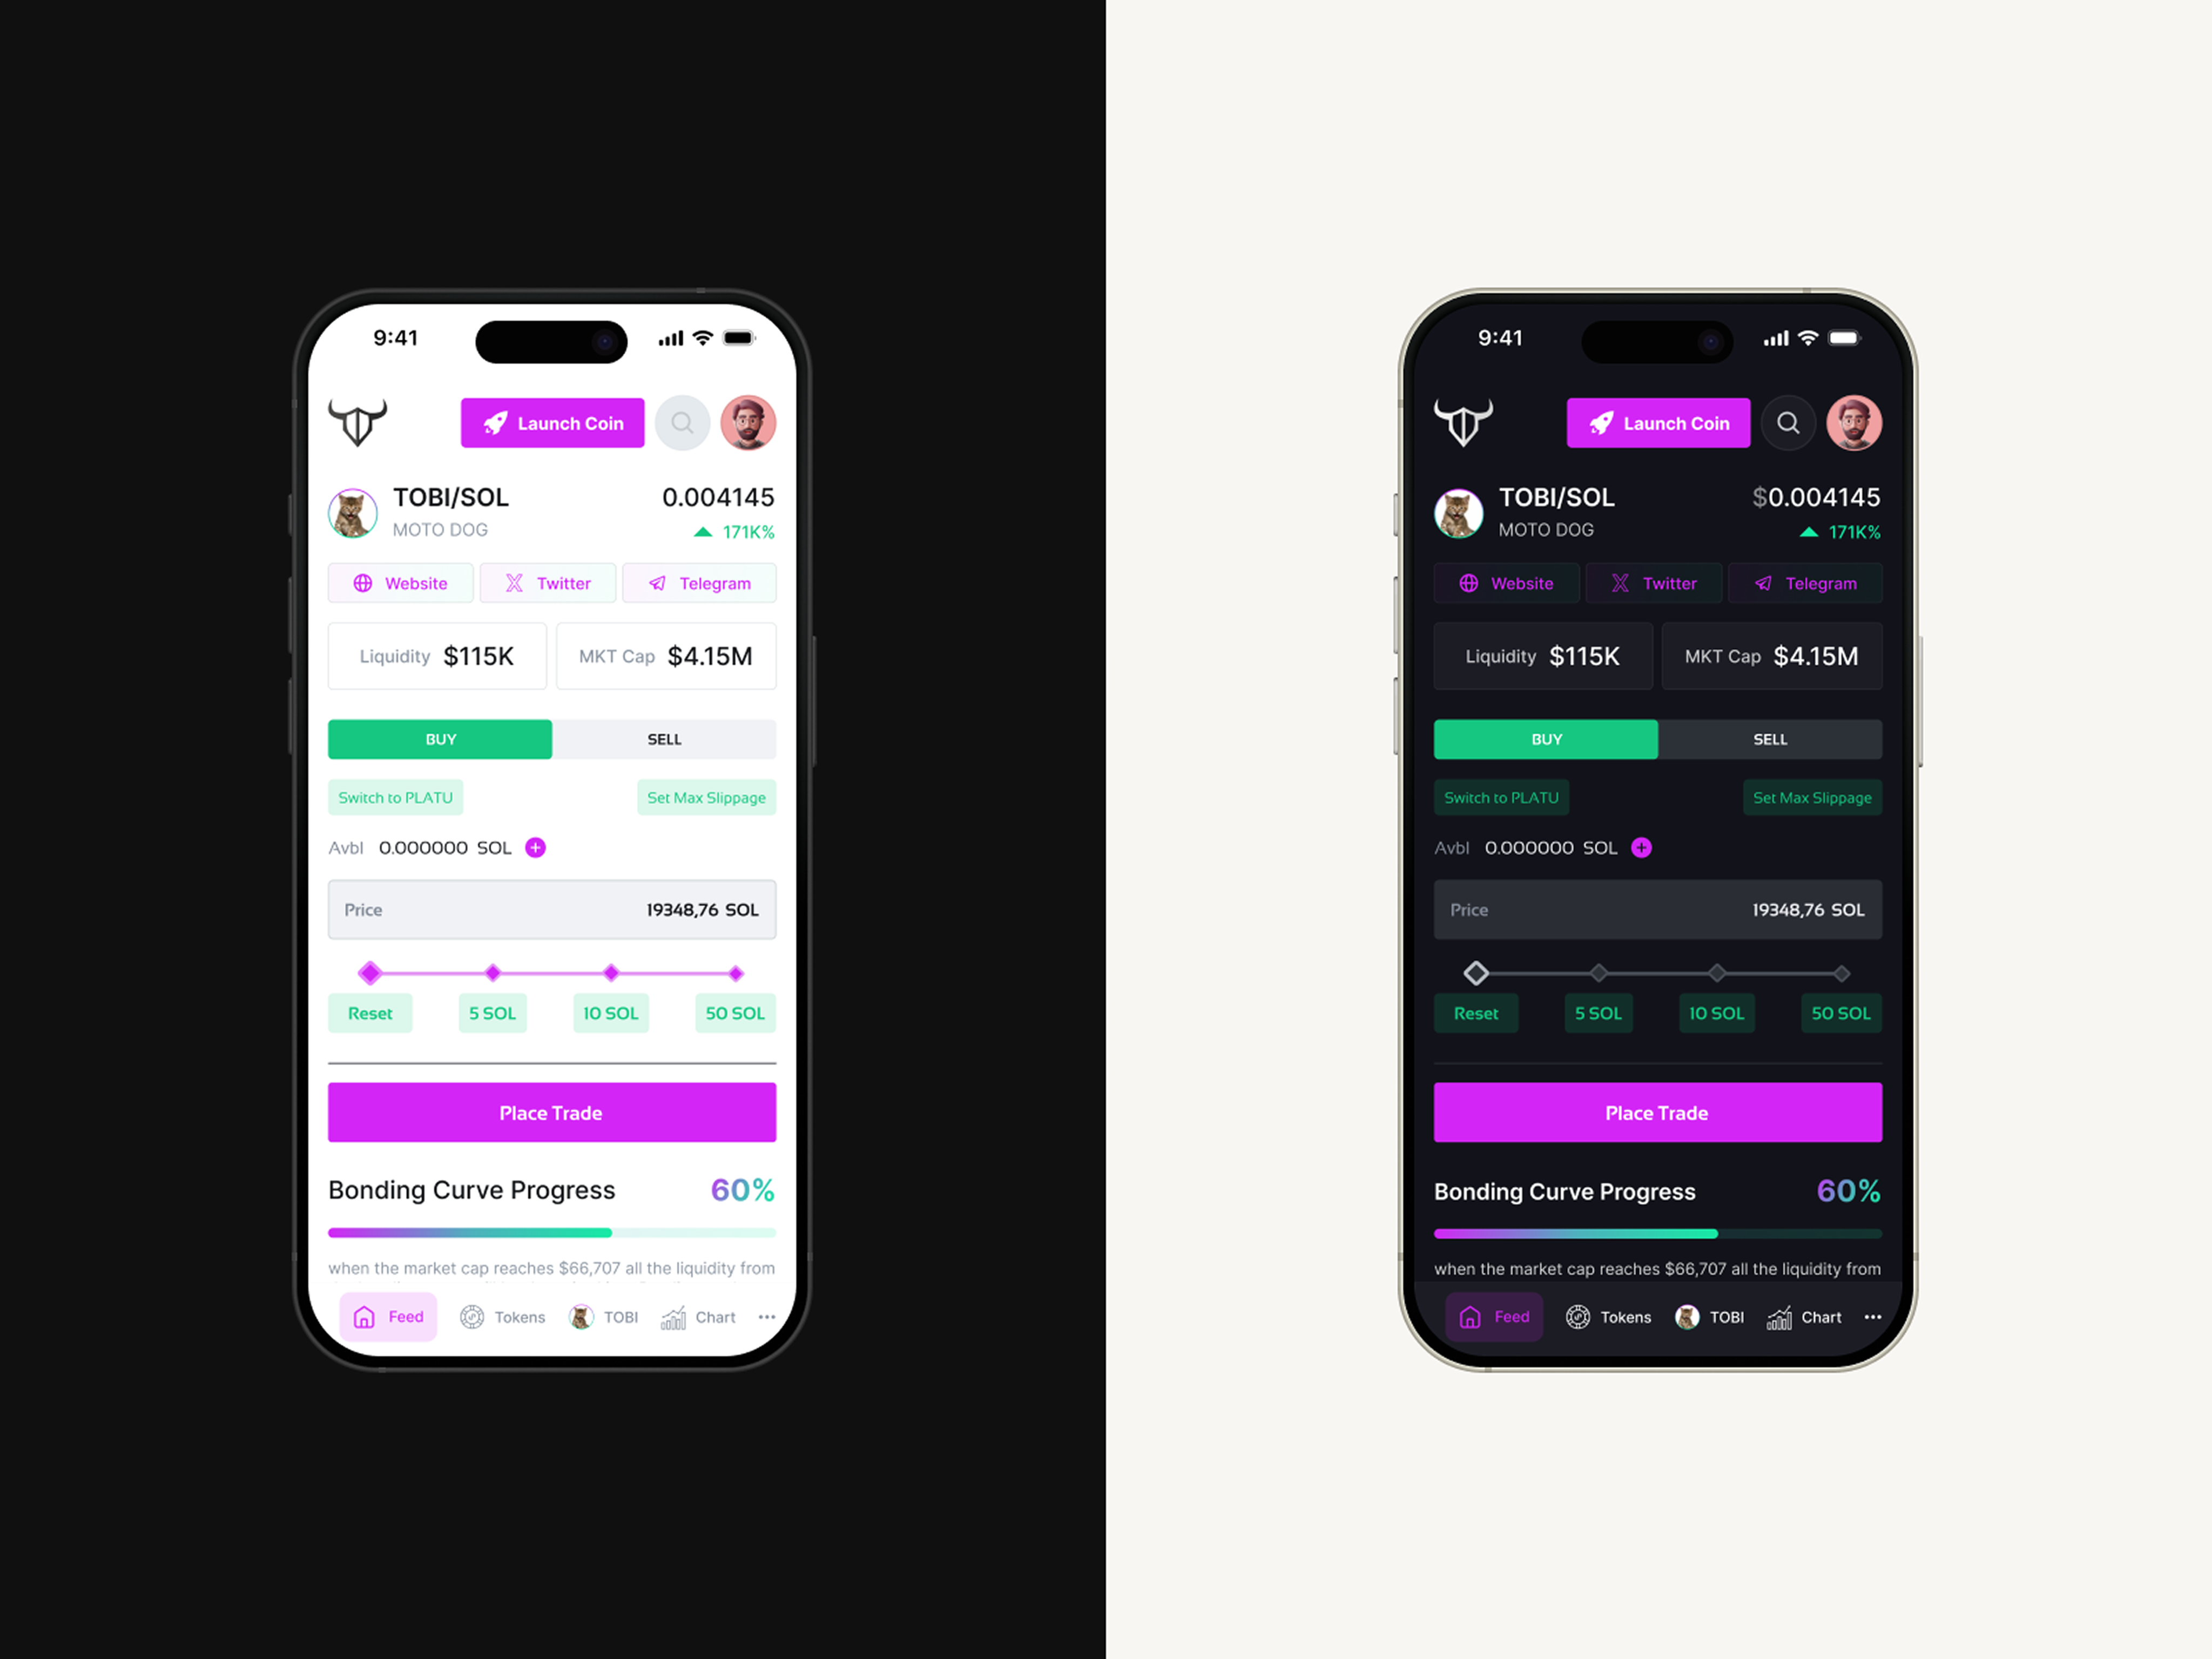
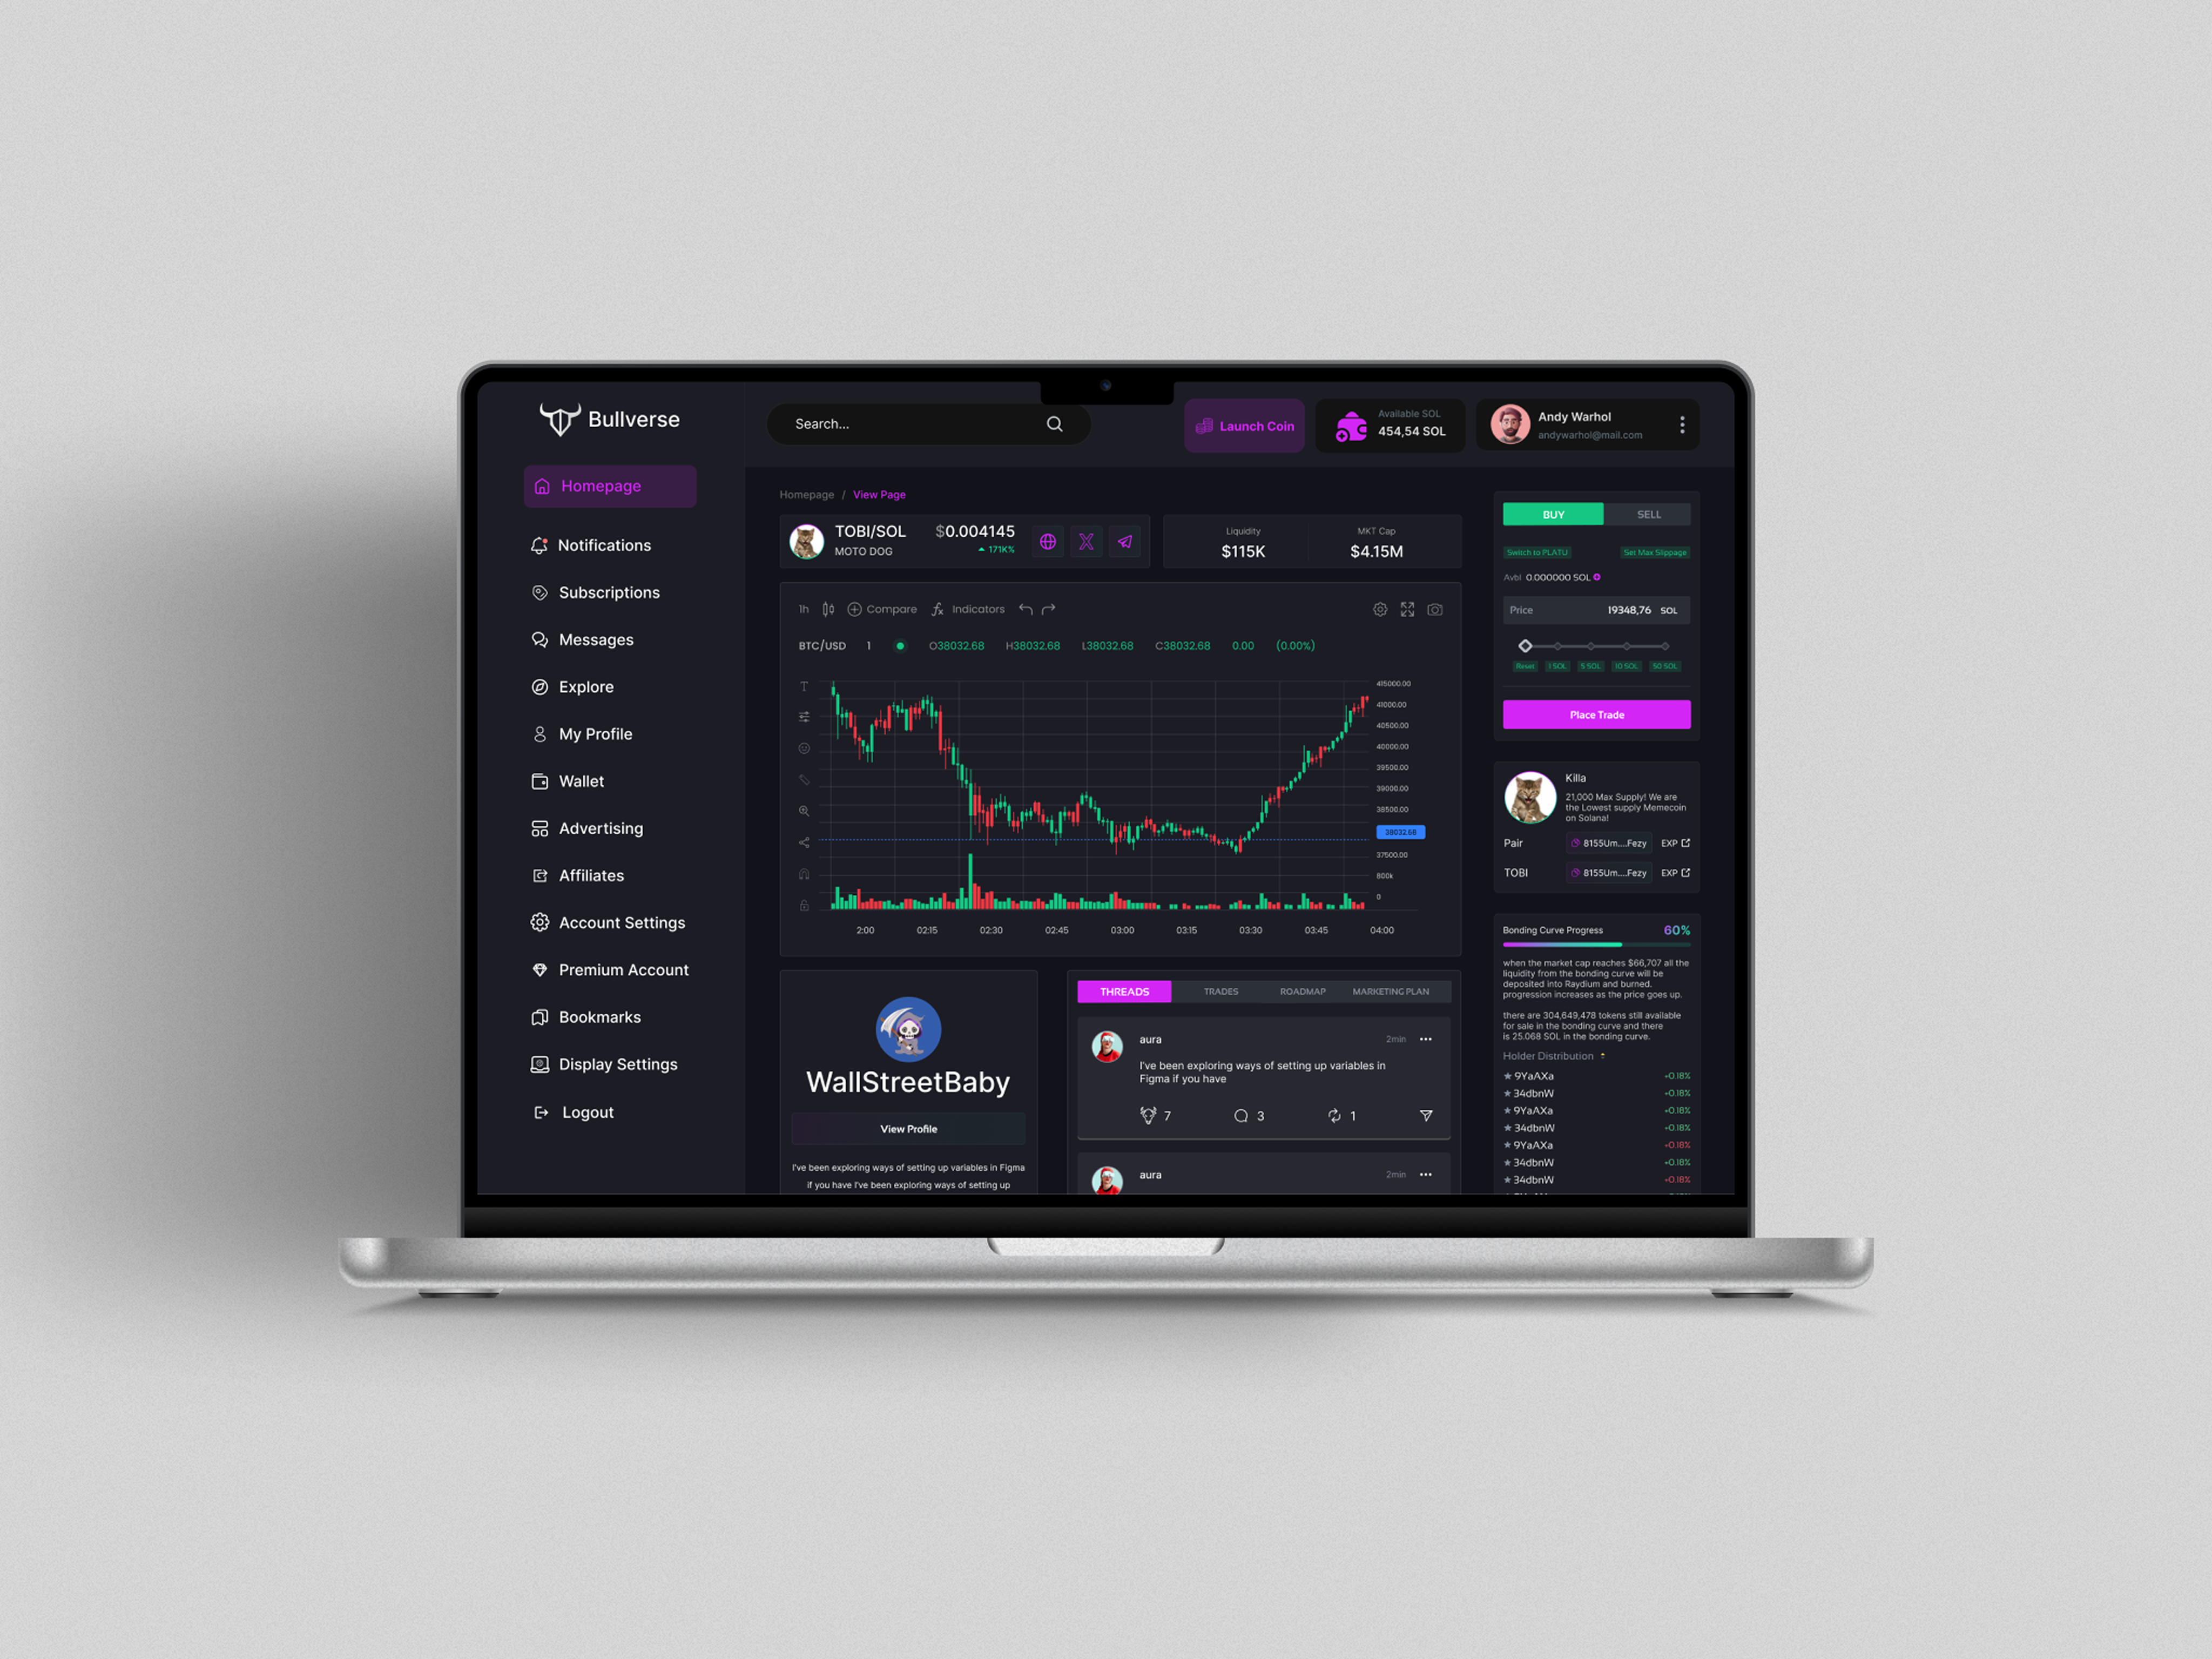
Bullverse began with a bold idea: to simplify token discovery, trading, and community interaction, and that vision was turned into a fully functional product with the right strategy and support.
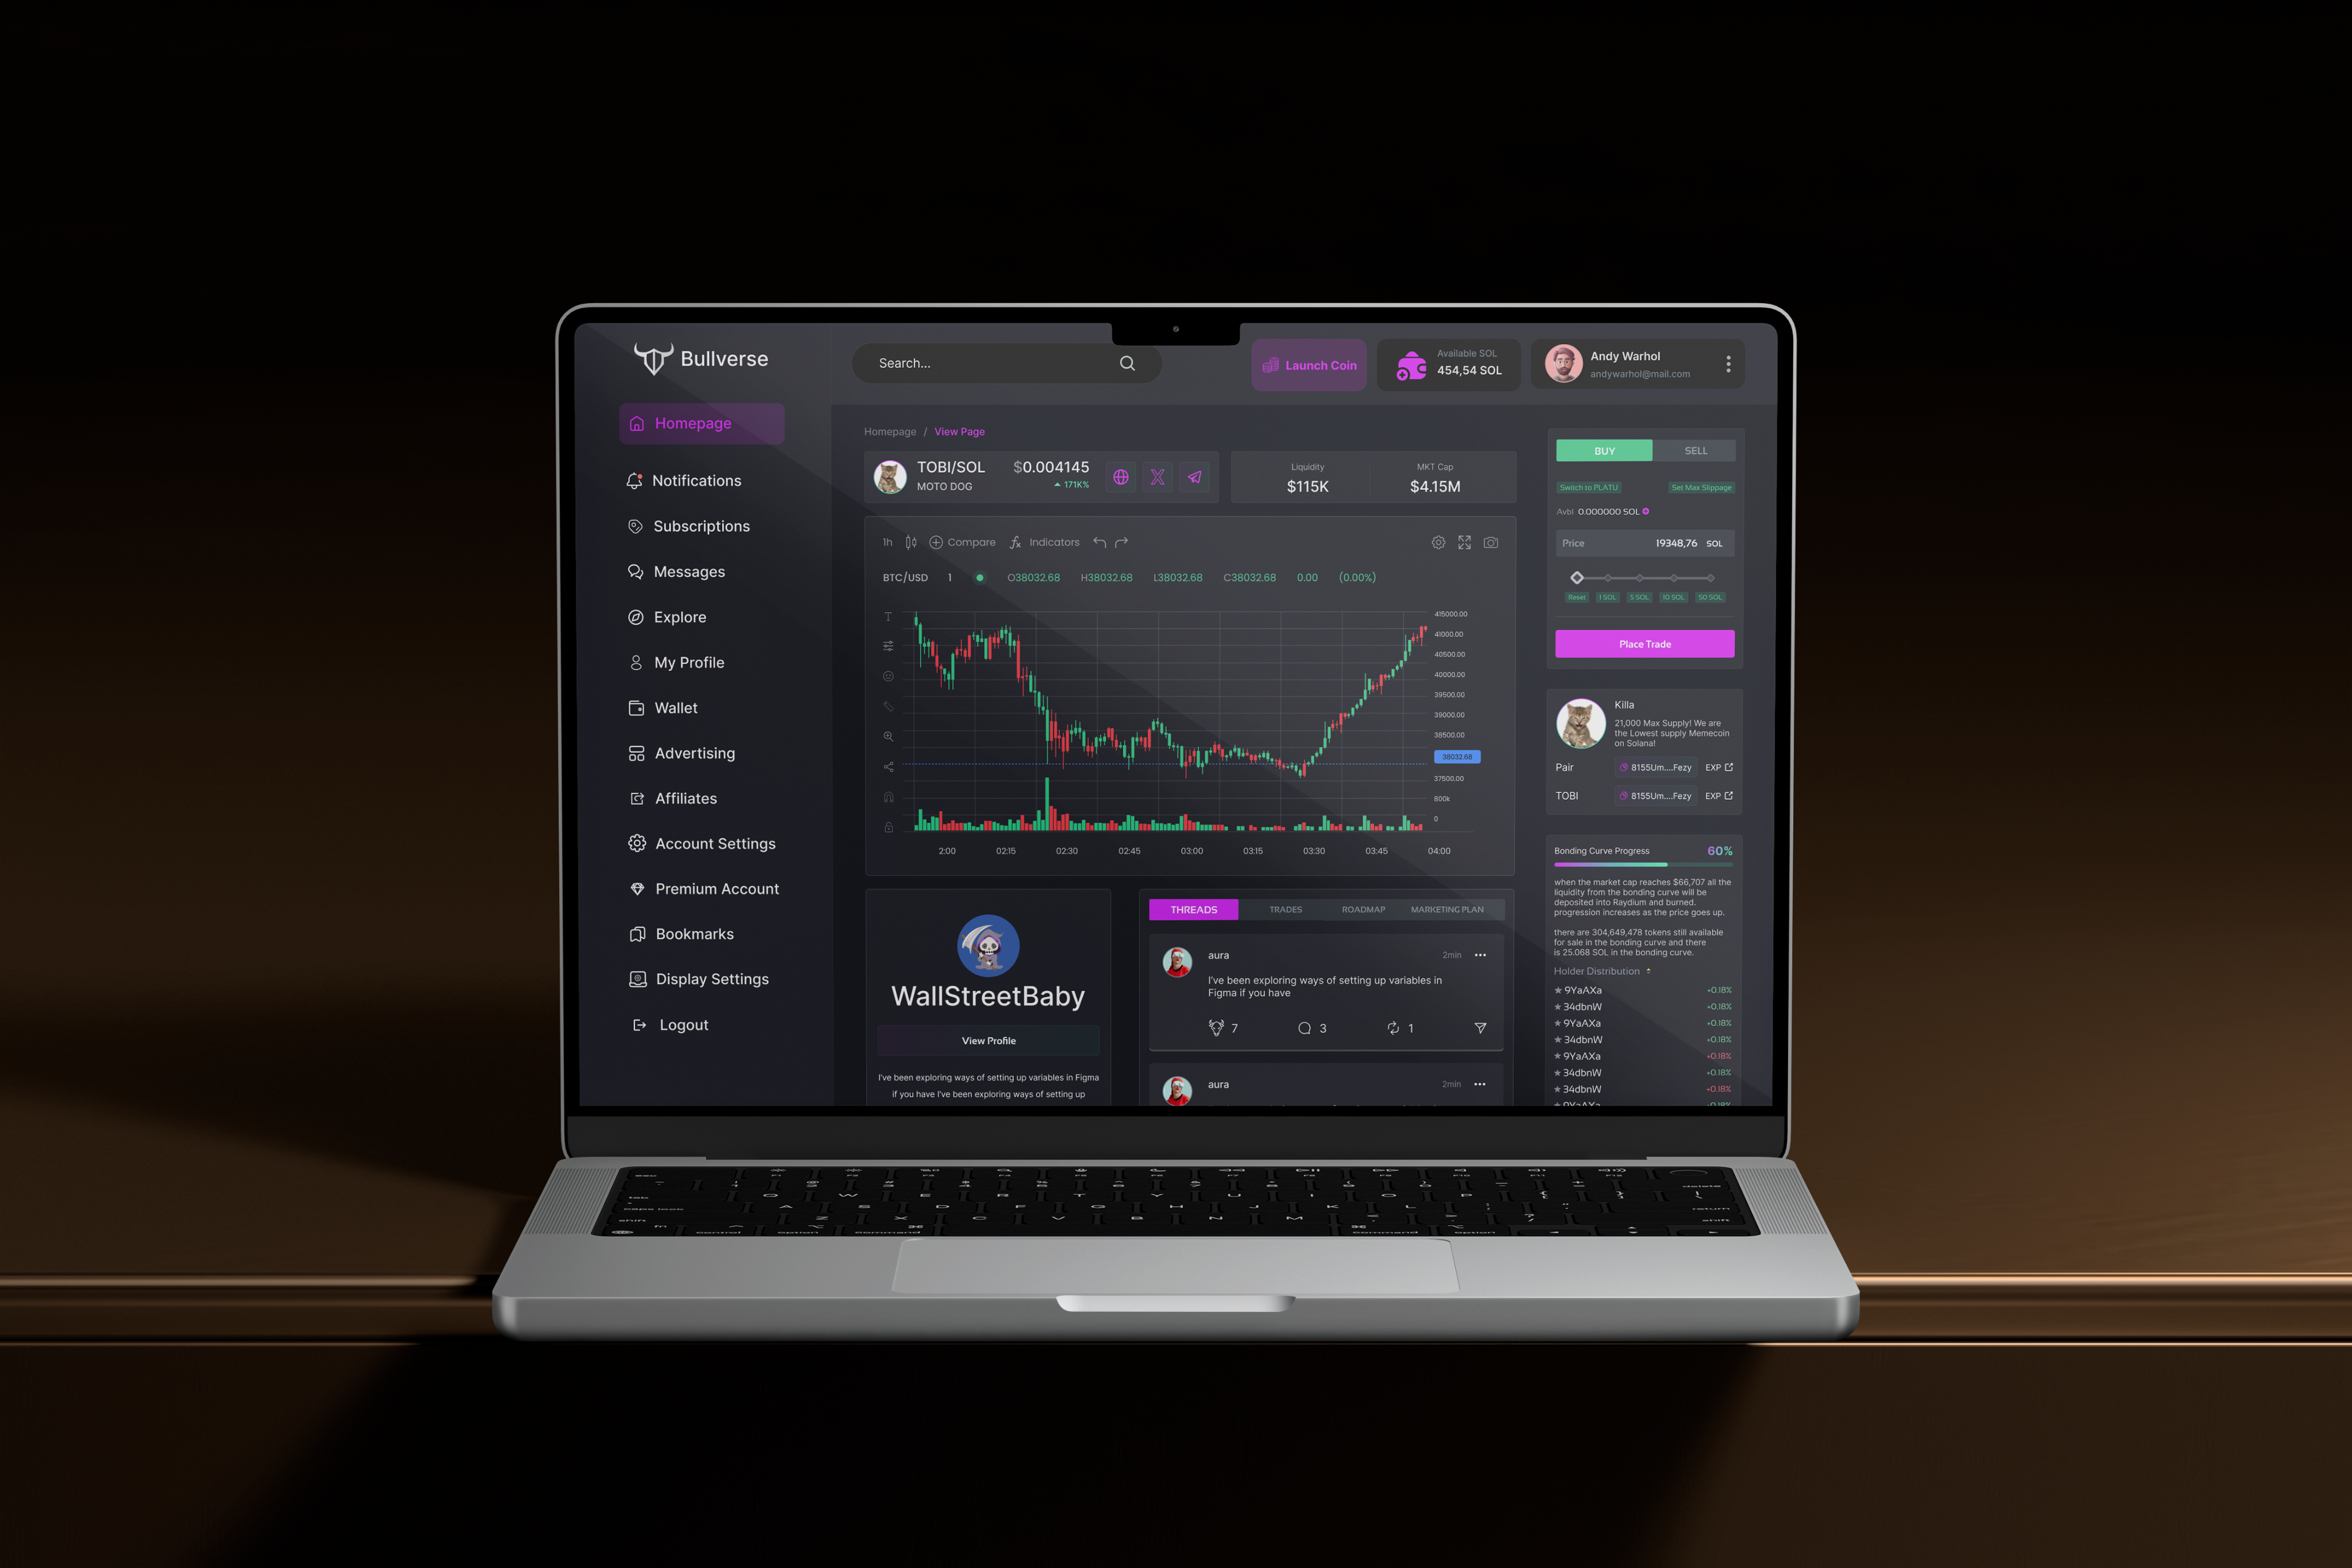
The founder of Bullverse identified a key problem in Web3: most token analytics and trading platforms were cluttered, confusing, and built for experts instead of everyday users. Traders cared about market cap, liquidity, token distribution, bonding curves, and developer transparency but this data was often presented in fragmented and overwhelming ways.
He envisioned a platform that would bring clarity to token discovery and trading transforming raw blockchain data into a clean, structured, and intuitive experience. Instead of forcing users to decode complex metrics, the product would deliver insights that felt transparent, empowering, and actionable.
To validate the idea, he needed a fully functional MVP. Rather than building an in-house team, he partnered with an experienced product studio to design and develop the platform from scratch turning the concept into a scalable Web3 solution.
This case study tells how we partnered to build the Bullverse MVP from scratch, and how the token analytics and trading platform we delivered validated the business concept while laying the foundation for future growth and long term collaboration.
Get a similar solution
The idea behind Bullverse was simple: give crypto users clarity and control when exploring and trading tokens. But the reality of blockchain data is anything but simple. Users are faced with an avalanche of information daily, including price charts, liquidity, holder distribution, bonding curves, and contract details, and to make things more complex, all of it changes in real time.

“Design is not just what it looks like and feels like. Design is how it works. It’s about creating products that are intuitive, purposeful, and seamlessly solve real problems.”
— Steve Jobs
1
The project began with clarifying goals, aligning expectations, and defining what the new website needed to achieve for Point Express.

2
Next came a quick analysis of logistics and dispatch websites to understand industry standards and shape the overall structure.

3
With insights in place, the full page layout was drafted in detailed wireframes to establish content flow and hierarchy.

4
The wireframes were reviewed together with the client, refined based on feedback, and finalized into a clear site architecture.

5
The selected direction was expanded into all remaining sections, completing the full desktop design.

6
Once approved, the layout was adapted for mobile and tablet, and all assets were prepared for a smooth Webflow build.
The discovery workshop gave us a clear roadmap for the Bullverse MVP. With the strategy defined, our design and development teams began working in parallel, a workflow chosen specifically to accelerate the launch of the Bullverse platform.
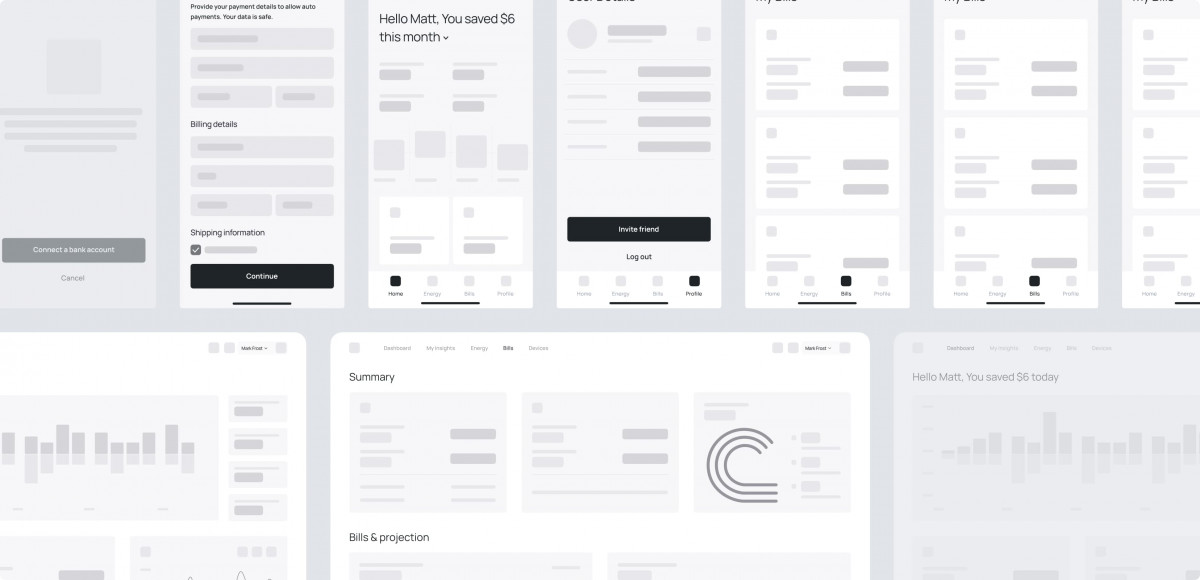
Our UX team was the first to lay the foundation for developers to write code on. We created the full information architecture, user flows, and a complete set of wireframes. This low-fidelity prototype allowed us to test the logic of the app with core users early on, ensuring the product was genuinely intuitive.
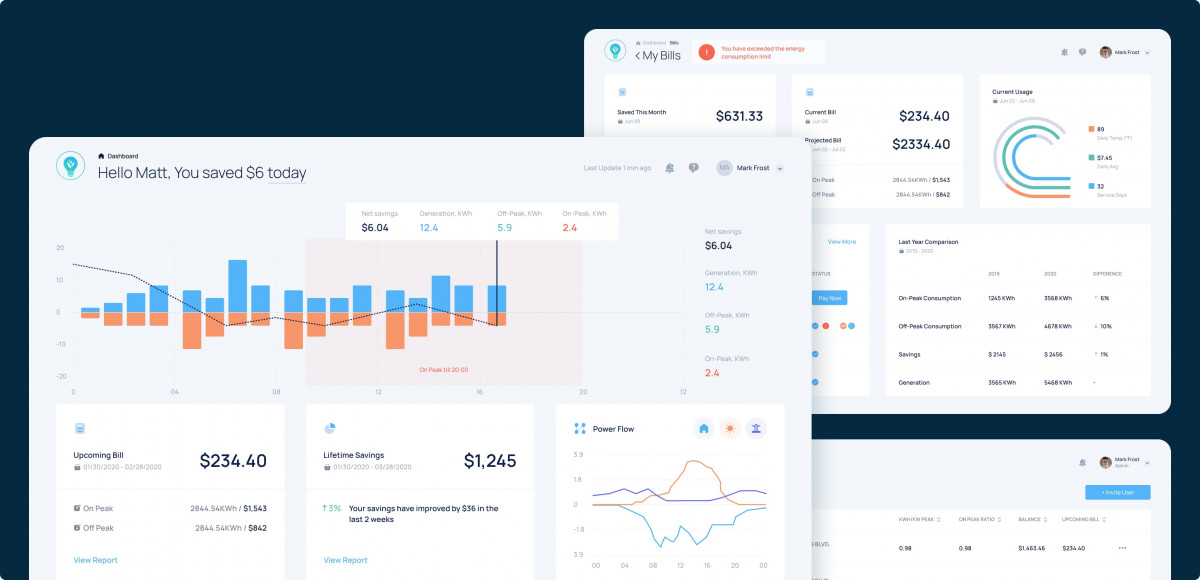
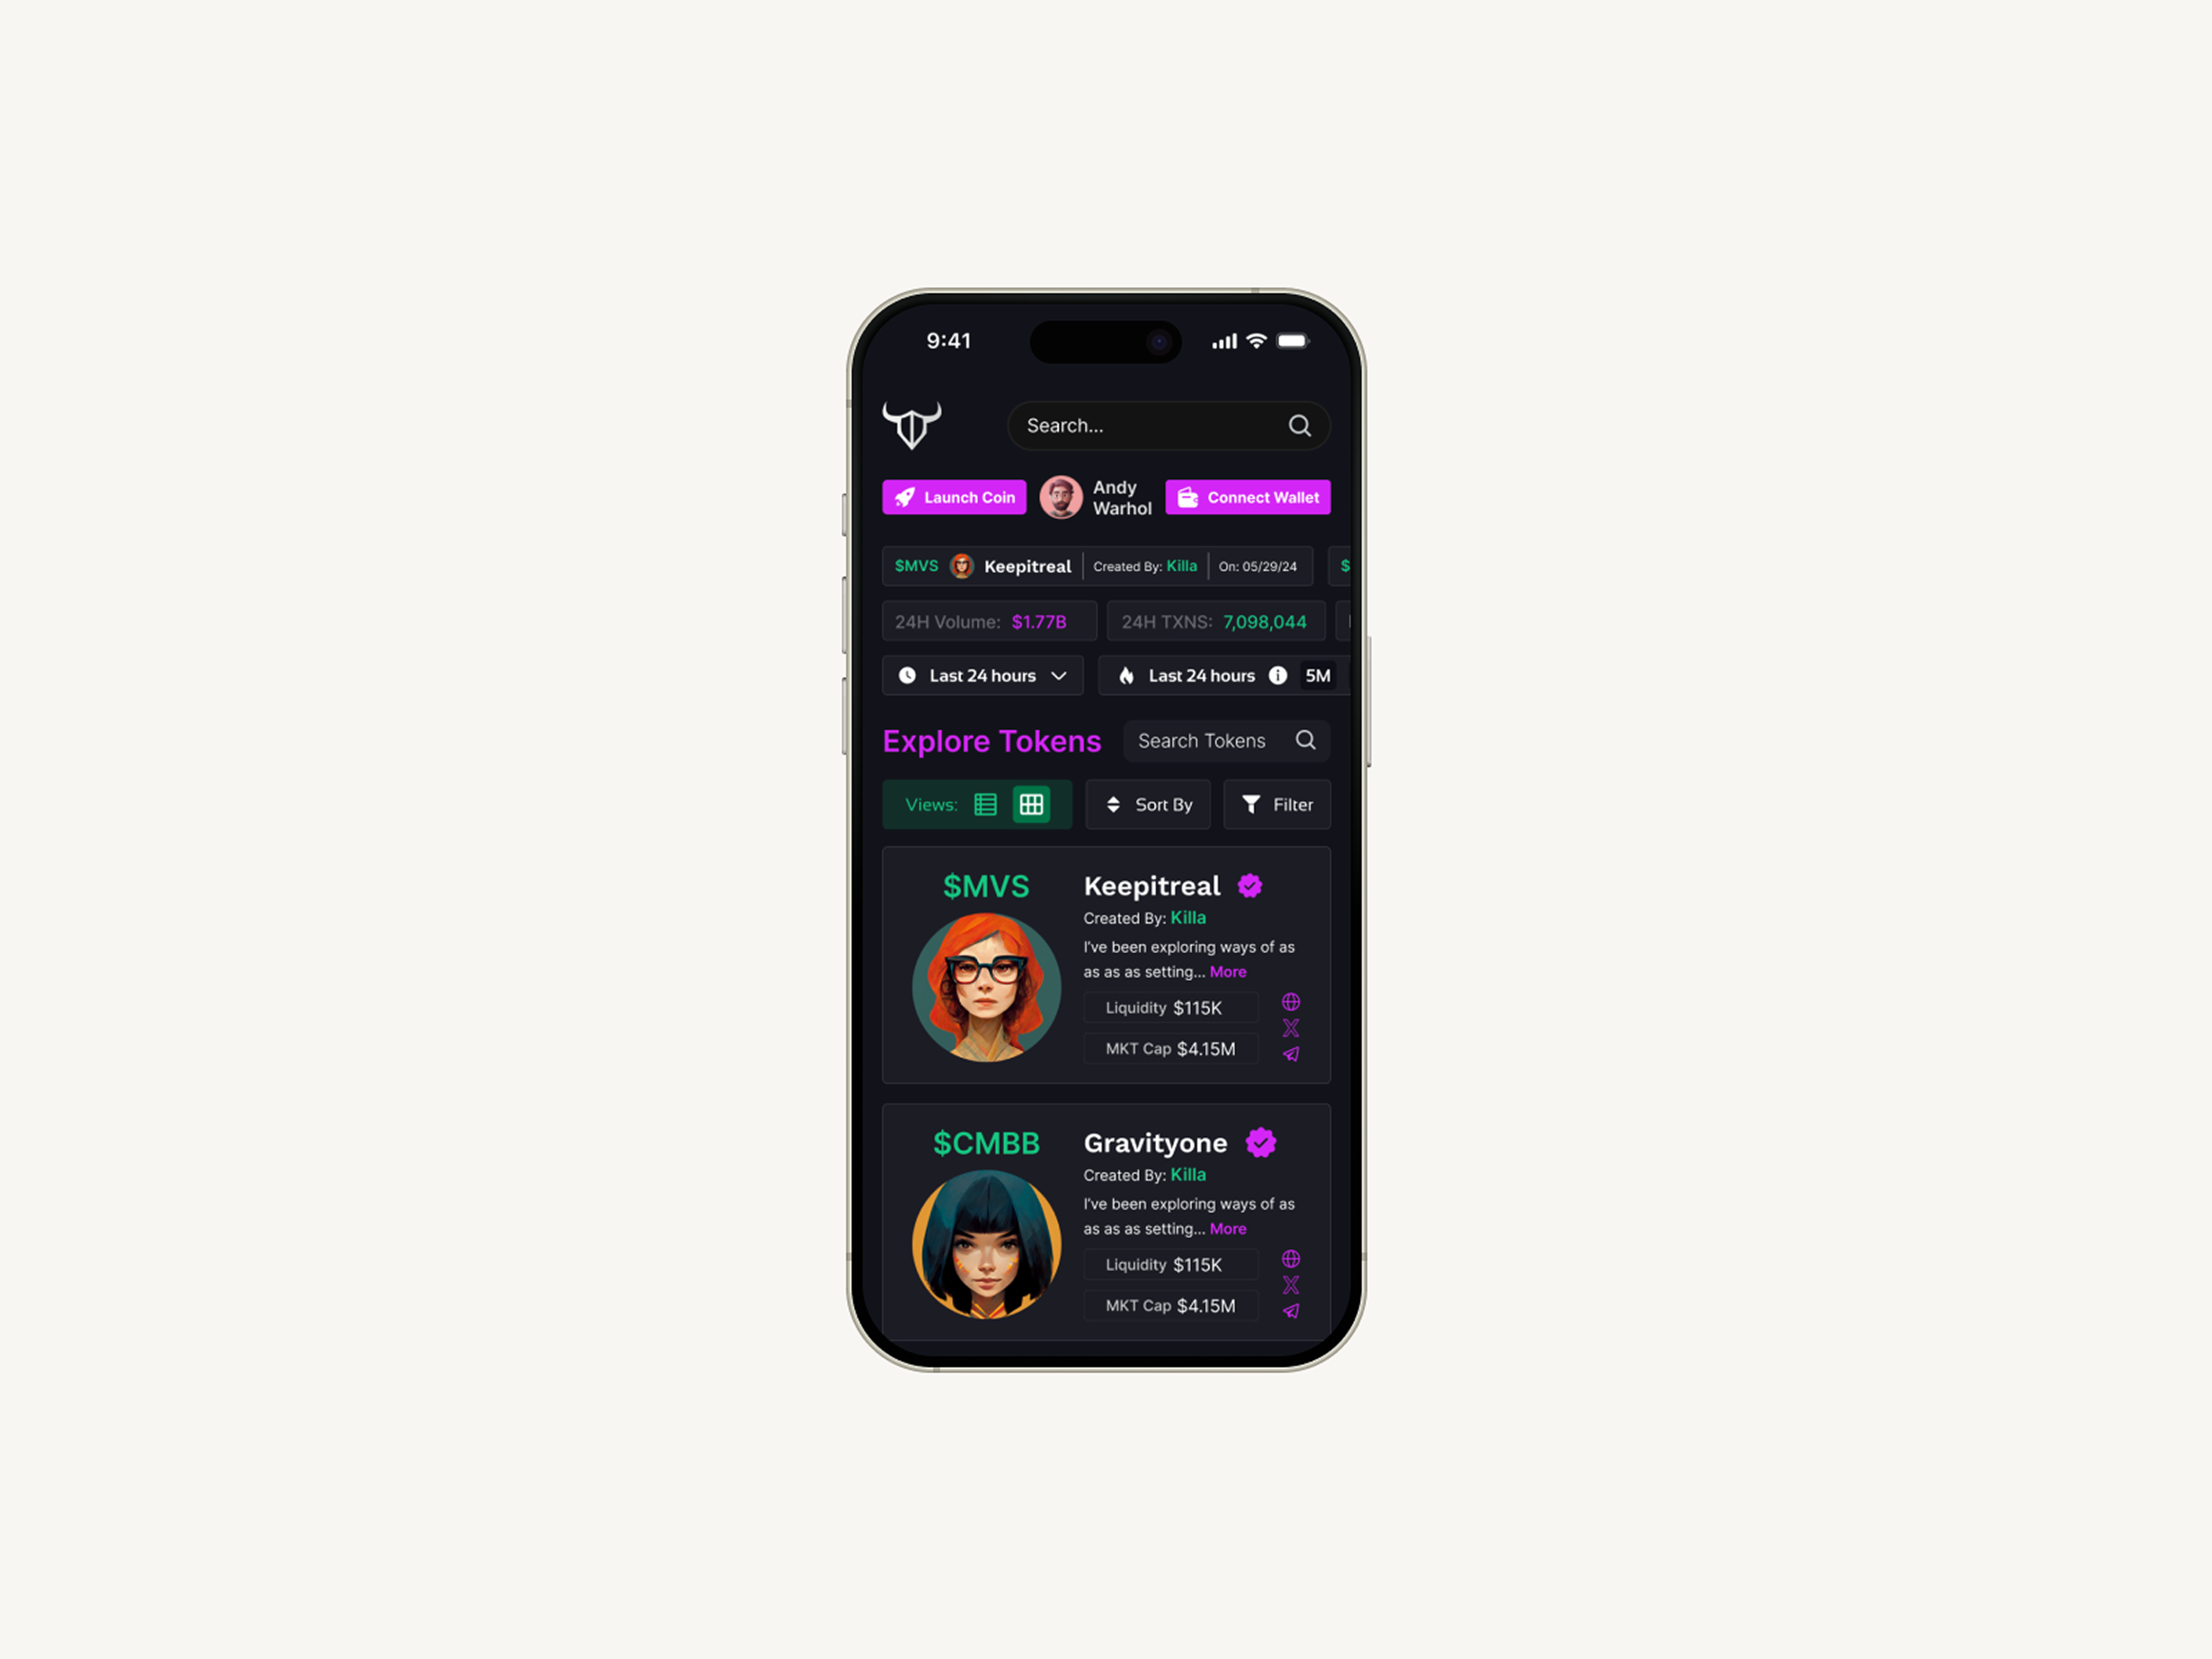
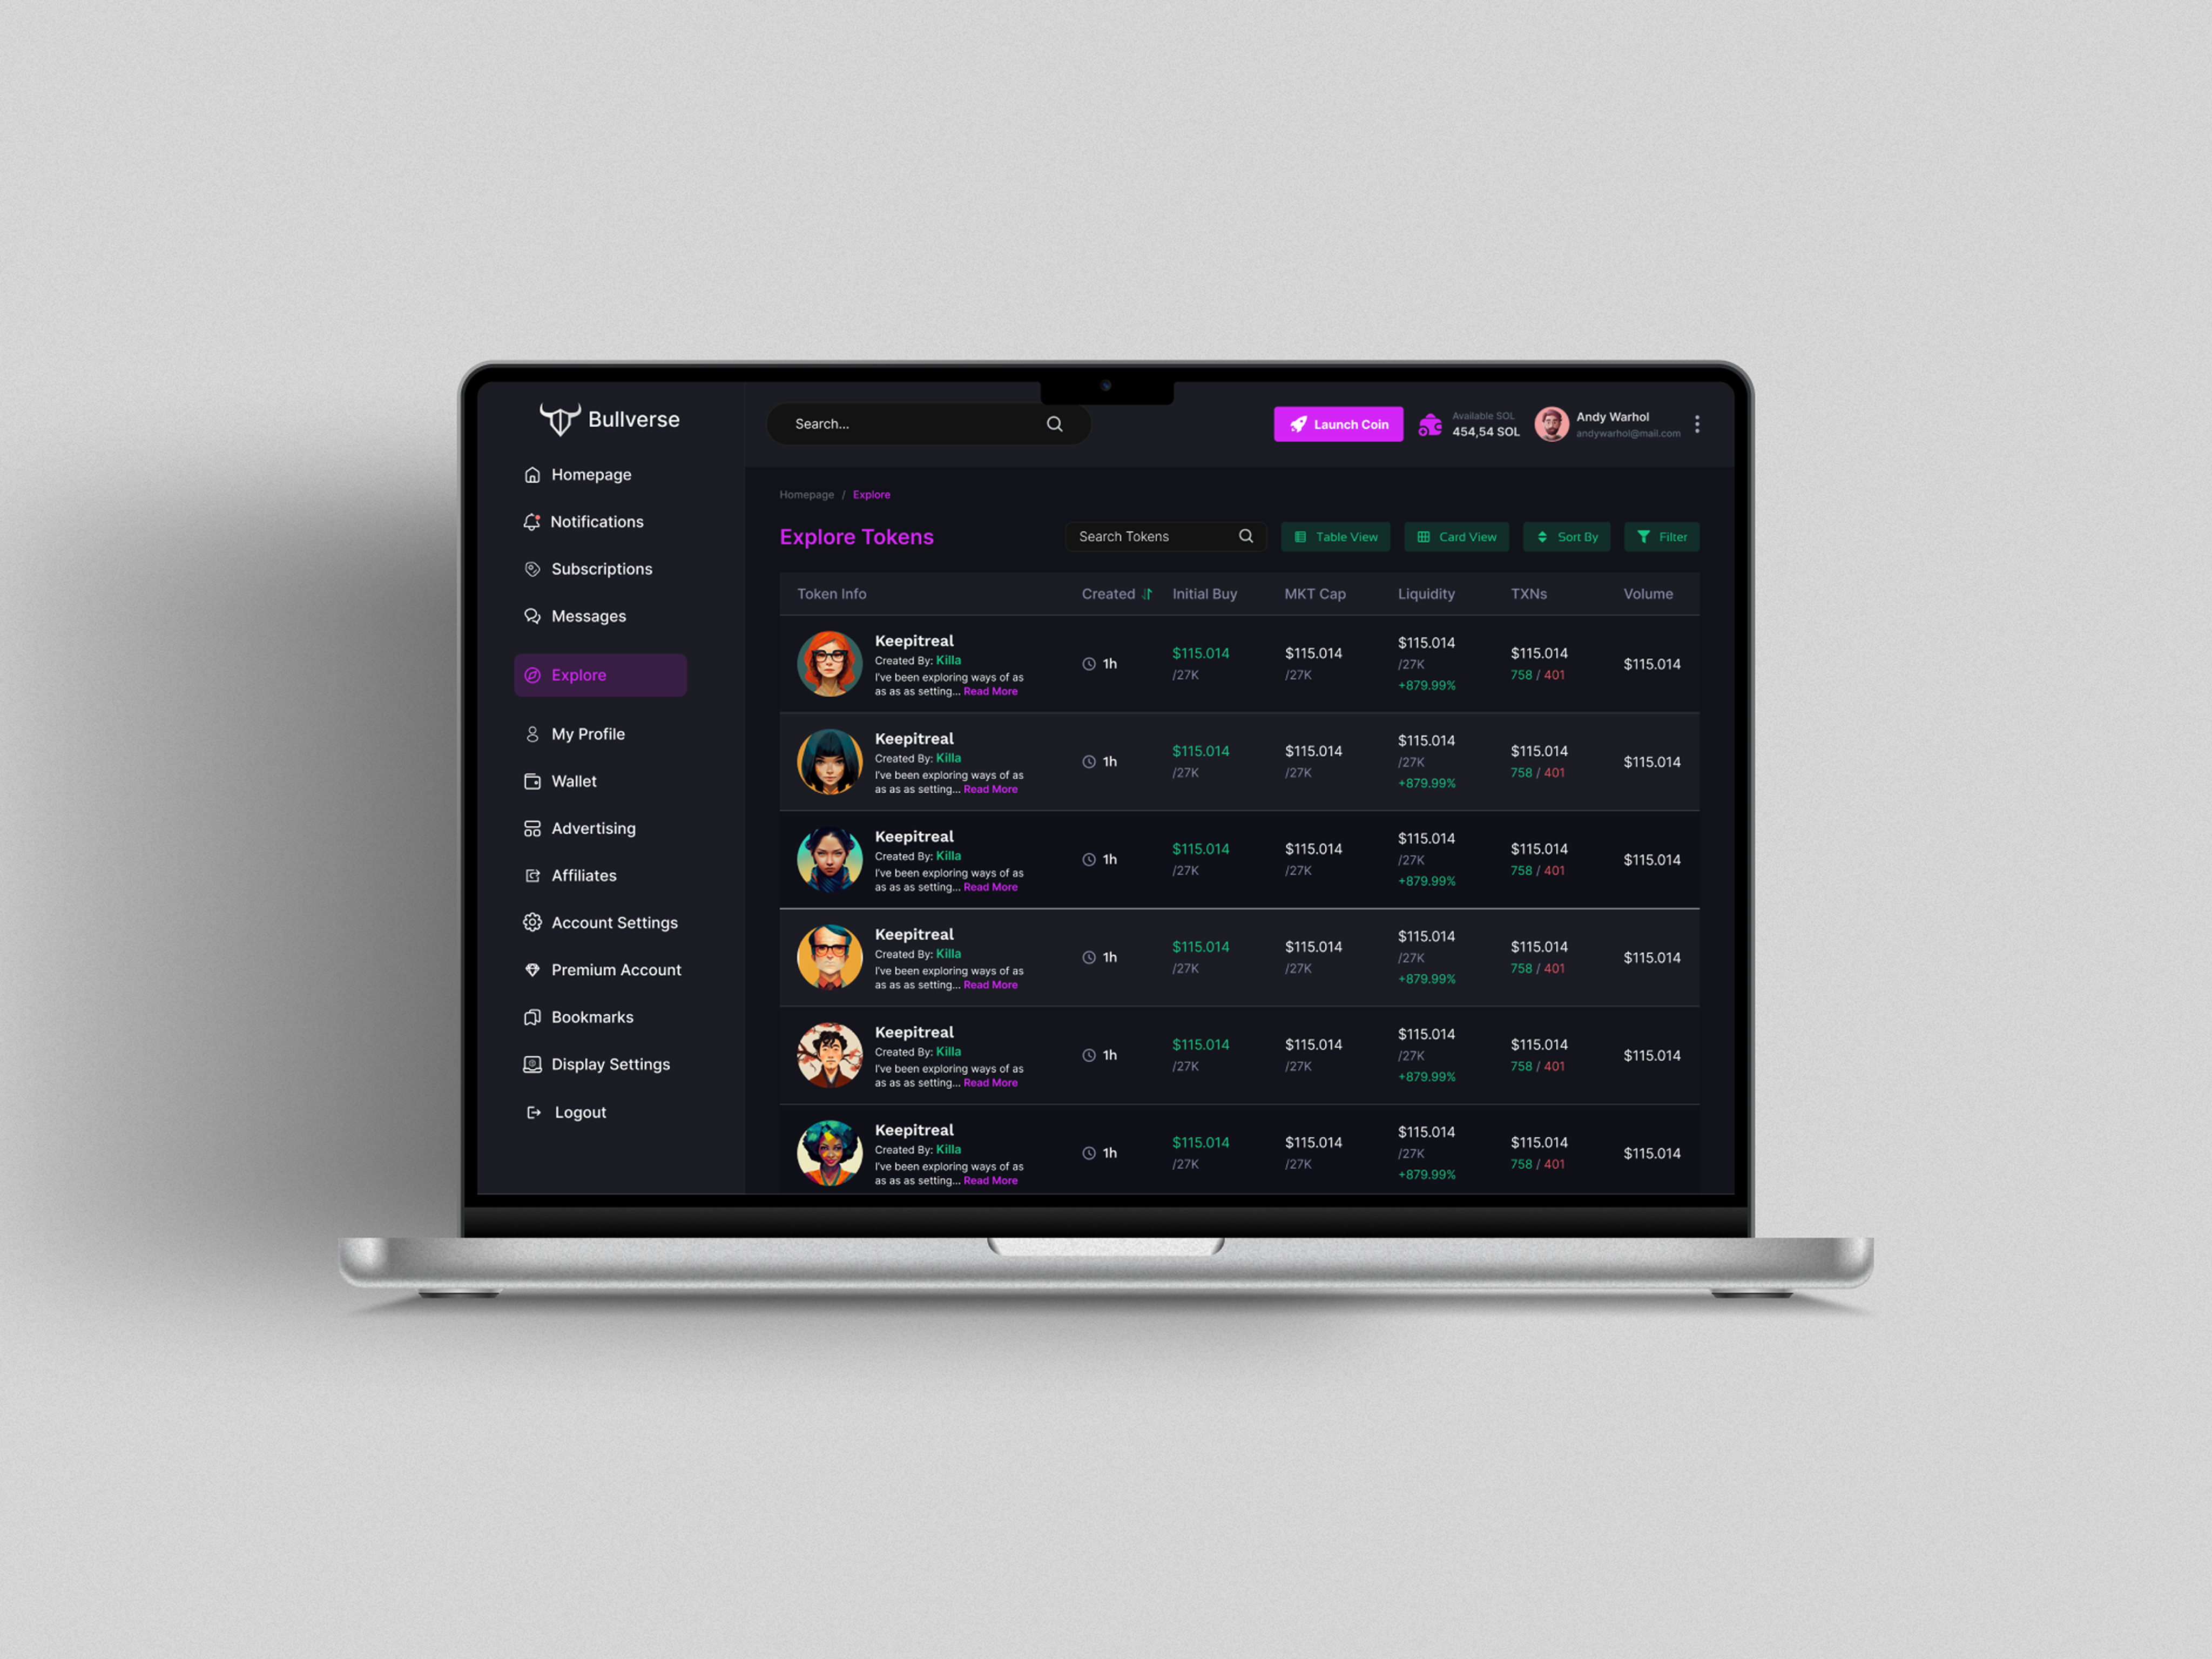
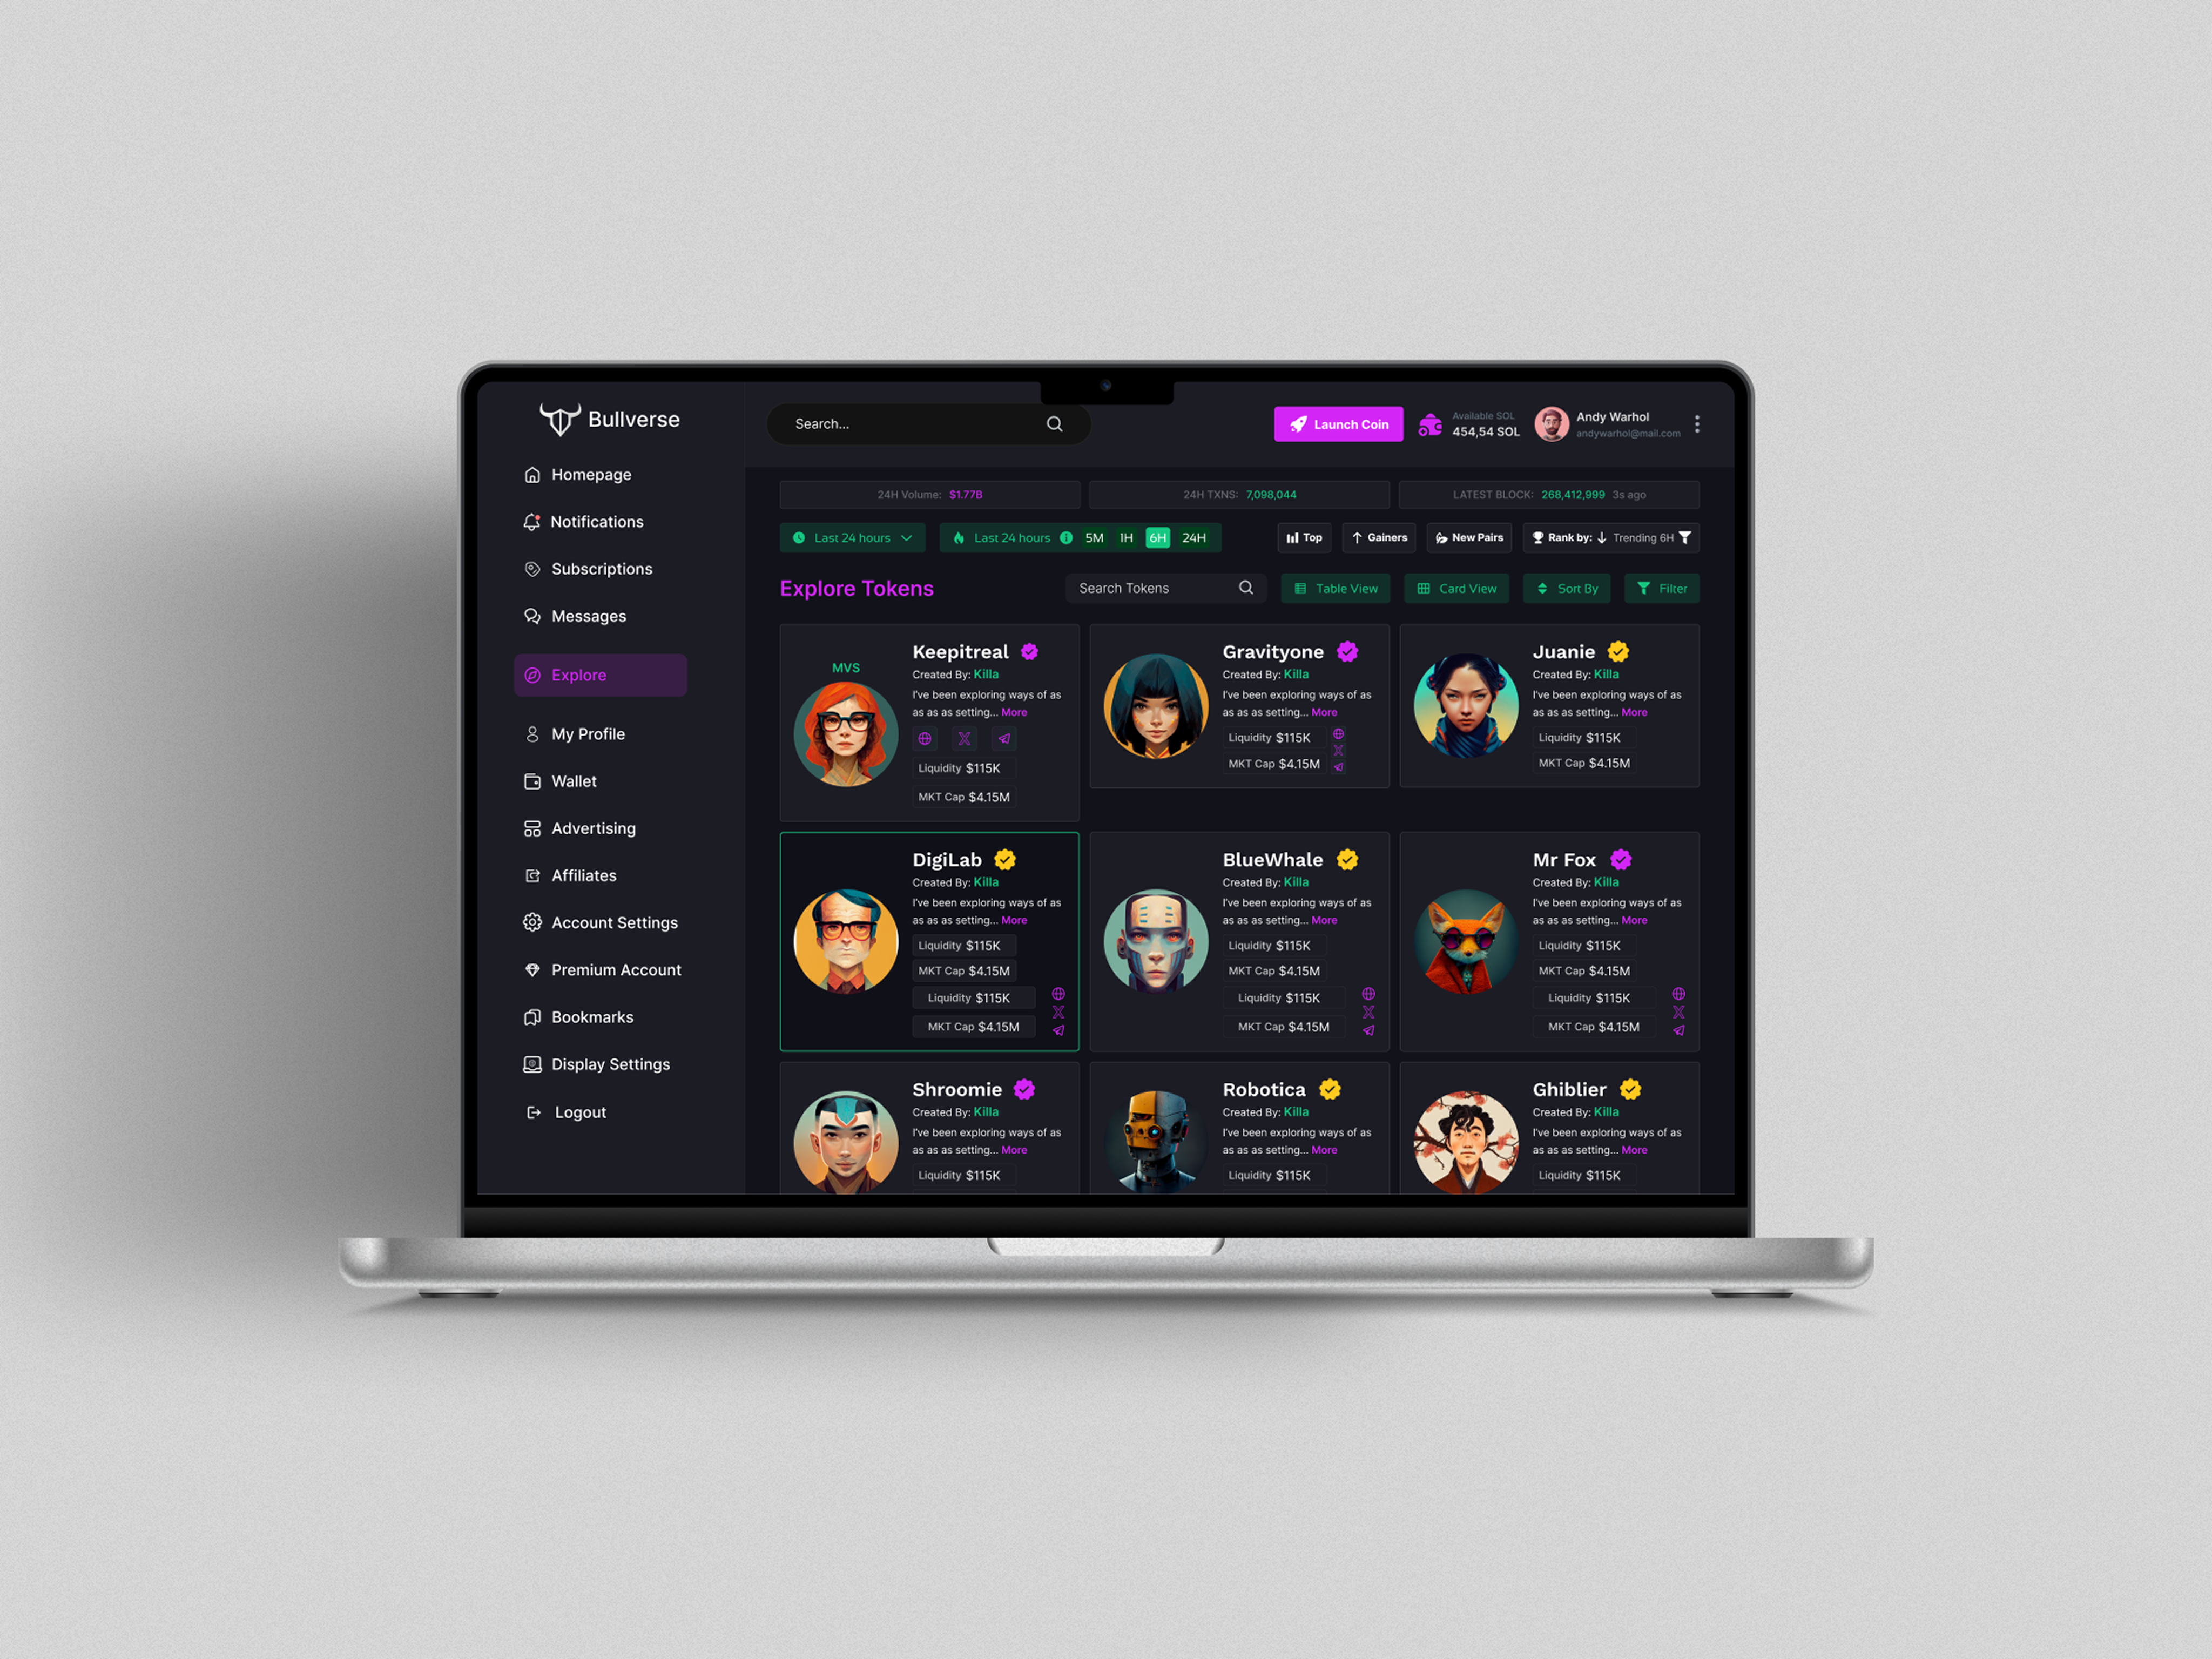
With the UX blueprint in hand, our UI team got to work on the visual design. Their main job was to turn a constant stream of technical energy consumption data into a simple, beautiful interface. They designed the interactive energy dashboards with a clean, mobile-first approach, knowing users would be checking their stats on the go. Every chart and graph was crafted to be instantly understandable.
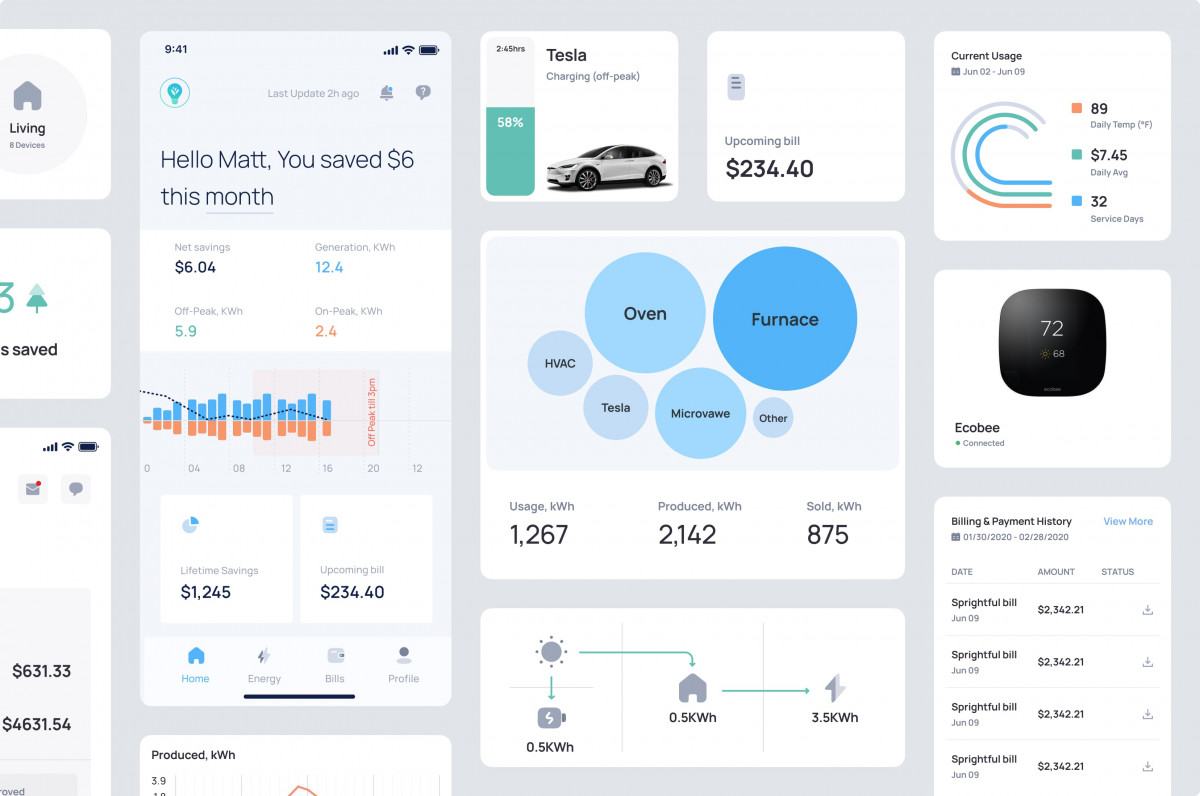
This was the time for our integrated team to shine. Our front-end and back-end developers worked together: the backend team built the system to connect to the solar devices via a cloud API, grabbing new data every five minutes. They also wrote the complex “Smart Billing Calculations” that compared a user’s solar savings against what they would have paid to the grid.
Our frontend team then took those designs and live data and brought them to life. Using React, they built a responsive user interface that became the final product.
Client got exactly what they needed: a functional MVP that allowed them to “validate plenty of ideas” and test the market. Our job didn’t stop at delivery, either. After deployment, our team noticed a way to optimize the database. By introducing new indexes, we decreased the data read time and reduced the client’s operational costs.